25 September 2011
Cleaning Wikileaks Data for Use in Google Mapping Applications (Part 1 of 2)
Over the past year, Wikileaks’ release of large troves of classified documents, reports, cables, and other information has demonstrated the increasing importance of data-driven journalism, a form of journalism in which large datasets are filtered and analyzed to produce new stories and infographics, a many of which have a geospatial bent.
In releasing information this way, Wikileaks has altered the way the general public can access and understand news reports by making available the sources that many of the major news outlets have been using to drive their coverage. These releases have also demonstrated that datasets must be clean and contextualized if they are to be properly understood.
Indeed, although flashy interactive maps and other online applications get a great deal of press, over 80% of the work involved in creating these data-driven applications involves cleaning and parsing the data informing the application so that it can be understood by both computers and users.
This tutorial demonstrates how to download, decompress, parse, and clean Wikileaks data with an eye towards using the data in other web applications. This type of work is not glamorous, and can sometimes be rather mind-numbing, but the cleaning and contextualizing of datasets is essential work for any data-heavy visualization.
Note: This is part 1 of a 2-part tutorial. In the second part, we will import the dataset you produce here into Google Fusion tables and then visualize it as a Google map.
Steps
-

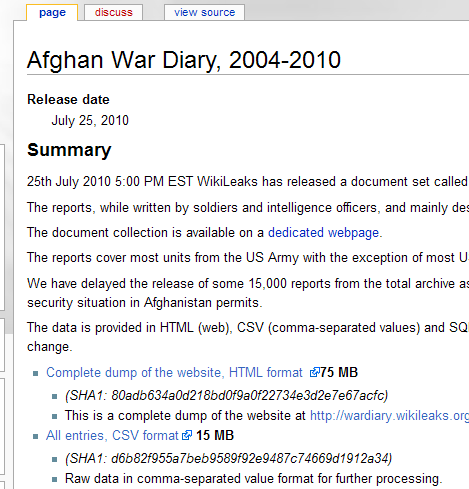
Choose the download option "All entries, CSV format". Download the Data
Given how often the main Wikileaks site (and how often most of the many mirrored versions of the Wikileaks site are also down), getting the data is sometimes the most difficult step. The Afghan War Diary data, however, is usually accessible via the mirror.wikileaks.info page, which currently serves as the wiki of Wikileaks.
The main page for the Afghan War Diary in the wiki is here: http://mirror.wikileaks.info/wiki/Afghan_War_Diary,_2004-2010/
Go to the page, and then download the data in .csv (comma-separated values) format. This should be the second option listed in the list at the bottom of the page.
Note: If for some reason these sites are down and you’re having problems accessing the dataset, try using this public Google Fusion Table, “Wikileaks Afghan War Diary, 2004-2010.” First click on the link and then click on File / Export via the menu at the top left. This should lead to your downloading the entire dataset in a .csv format. If you take this step, you may skip Step 2.
-
[caption id="attachment_207" align="alignnone" width="150" caption=""]

Decompress the Data
But wait, the file you just downloaded isn’t a .csv file, it’s a 7z file.
What is a .7z file?
It is a compressed file format much like a .zip file. You will need to download special software to extract data from this .7z file.
Windows users can use the 7-zip site to download their own file archiver.
Mac users will have to use a different program, as the 7-zip file archiver is only built for windows. Ez7z seems to be the preferred archiver for the Mac user. Mac users may need to ensure that the compressed filename ends in .7z.
So go ahead and download an archiver, and then use it to extract the .csv file.
-
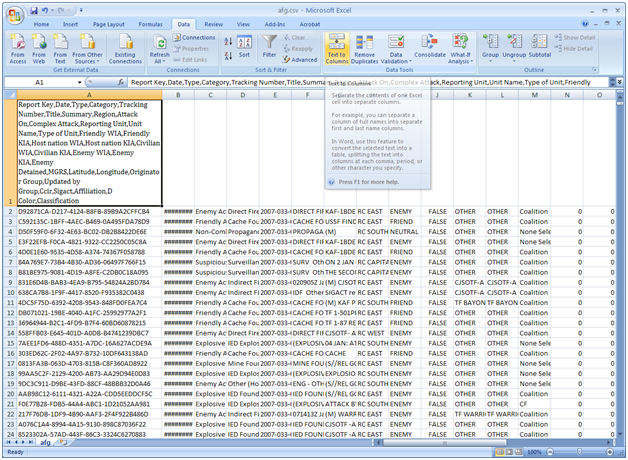
[caption id="attachment_169" align="alignnone" width="150" caption="Use the list to the left and the “Text to Columns” option in Excel to create your column headings."]

Understand the Data
Like most data, the Wikileaks .csv file needs some clean up. First of all, the columns have no titles, and this lack of documentation/metadata makes some of the entries unintelligible on first glance. Luckily, this dataset has been uploaded and published in a variety of different places, so simply copying a string from one of the more arcane cells, such as the first cell (“D92871CA-D217-4124-B8FB-89B9A2CFFCB4“), and then Googling that string will often lead you to a site that documents the war logs.
One site I’ve found particularly helpful is here: http://afghanwarleak.org/. From this site we can look at individual events, such as the event connected to the string above, to get the categories of information: http://afghanwarleak.org/war_events/D92871CA-D217-4124-B8FB-89B9A2CFFCB4
Using a site like this, we can deduce that the columns correspond to the following fields (in .csv format):
Report Key,Date,Type,Category,Tracking Number,Title,Summary,Region,Attack On,Complex Attack,Reporting Unit,Unit Name,Type of Unit,Friendly WIA,Friendly KIA,Host nation WIA,Host nation KIA,Civilian WIA,Civilian KIA,Enemy WIA,Enemy KIA,Enemy Detained,MGRS,Latitude,Longitude,Originator Group,Updated by Group,Ccir,Sigact,Affiliation,D Color,Classification
(If you’d like to import these into your excel sheet, insert a blank row, then paste this list into the first cell. After pasting, select the “Text toColumns” option in the “Data” menu and separate the text via each “comma” into separate columns. Here’s a tutorial on that process.)Now that we know what information is listed in the columns, we will also benefit from understanding the acronyms used within the columns. The Guardian has published a handy glossary of these terms here: http://www.guardian.co.uk/world/datablog/2010/jul/25/wikileaks-afghanistan-war-logs-glossary.
-
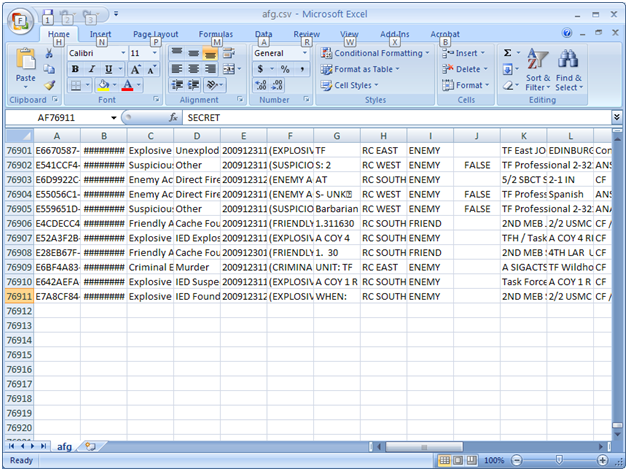
[caption id="attachment_169" align="alignnone" width="150" caption="That’s a big Excel sheet! Let’s make it more manageable."]

Parse the Data
Now that we understand the data fields and have a reference sheet to decipher what certain acronyms mean, we can go ahead and determine what aspect of the spreadsheet we’d like to visualize.
While visualizing the 76000+ events currently listed in the .csv file might give one a good sense of the overall picture of events in Afghanistan, limiting the visualization to one type of event might help you and your audience to see something more specific and more understandable. So let’s limit our dataset to only those events where enemies were detained.
First, sort your excel sheet by the “Enemies Detained” field, and then copy and paste all rows listing events where at least 1 enemy was detained (i.e. all cells that are greater or equal to 1) into a new Excel sheet. This should leave you with about 2373 rows of information, or 2372 events and one title row.
Save this file as a .csv spreadsheet (choose save as in excel, then scroll down in the “Save as Type” dropdown menu until you see the .csv option). We’re saving it as a .csv file rather than an Excel file because the Google Fusion tables work better with this simpler type of file.

