28 February 2012
Creating GIS Datasets from Historic Maps
This tutorial will teach you to extract features from georeferenced maps and store them in a geodatabase for use in ArcGIS.
Here are the basic steps we will go through in this tutorial:
- Download the ArcMap project containing the georeferenced map and extract it a local drive.
- Create a new file geodatabase for storing the spatial data.
- Create new layers (feature classes) for each theme of data being created.
- Digitize features from the map using ArcGIS.
Assumptions:
- You have basic computer skills and understand Windows directory structures.
- You have a good internet connection.
- You have ArcGIS 10 working on your computer.
The map used in this exercise is scanned (and used with permission) from “Forward is the Motto of Today” Street Railways in Charlottesville, Virginia 1866 – 1936 which is a detailed history of Charlottesville streetcar system.
We will create three layers – routes, system features, and city limits – from the map. We will add name and type attributes to the system features and routes layers.
Steps
-
Download, Extract and Open
a. Download the ArcMap project in a zip file named creatingGISdata.zip from /i/2012/02/cvilleTrolley1.zip (32MB) and save to your local drive. A zip file is a compression format that reduces file size and preserves directory structure. More information on Zip files here.
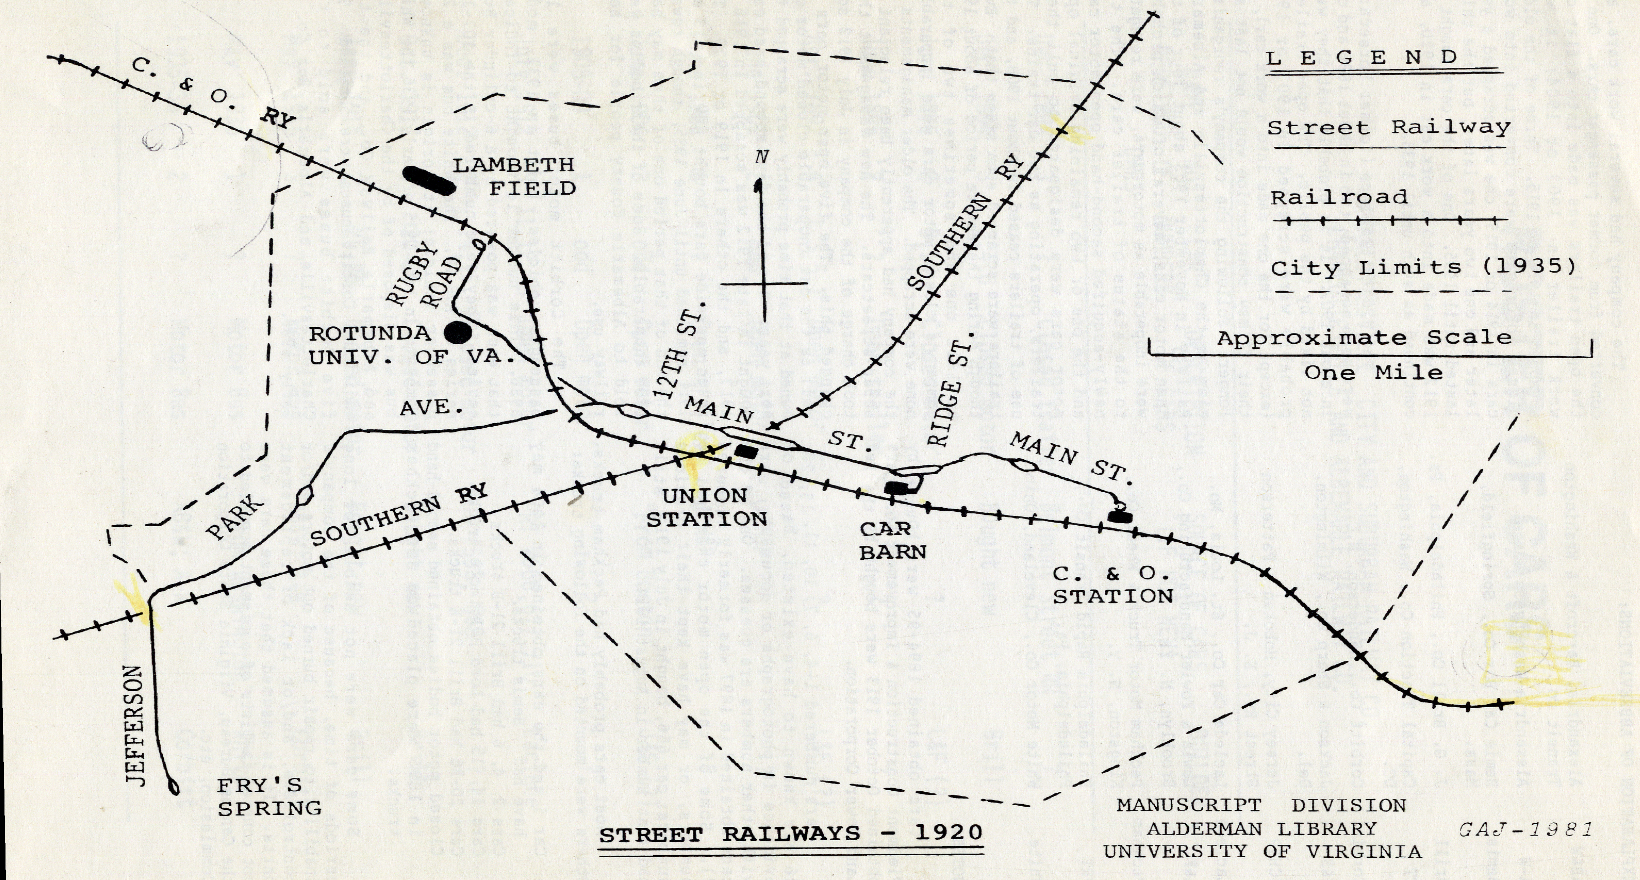
Trolley Map b. Extract the zip file to a local drive using WinZip, Windows Explorer or another program.
c. You should now find a directory called cvilleTrolley on your local drive in the location you designated in the last step.
NOTE: If you do not extract the zip file to your local drive, the ArcMap project will not work properly because the directory structure required for geodatabases and ArcMap is not available.
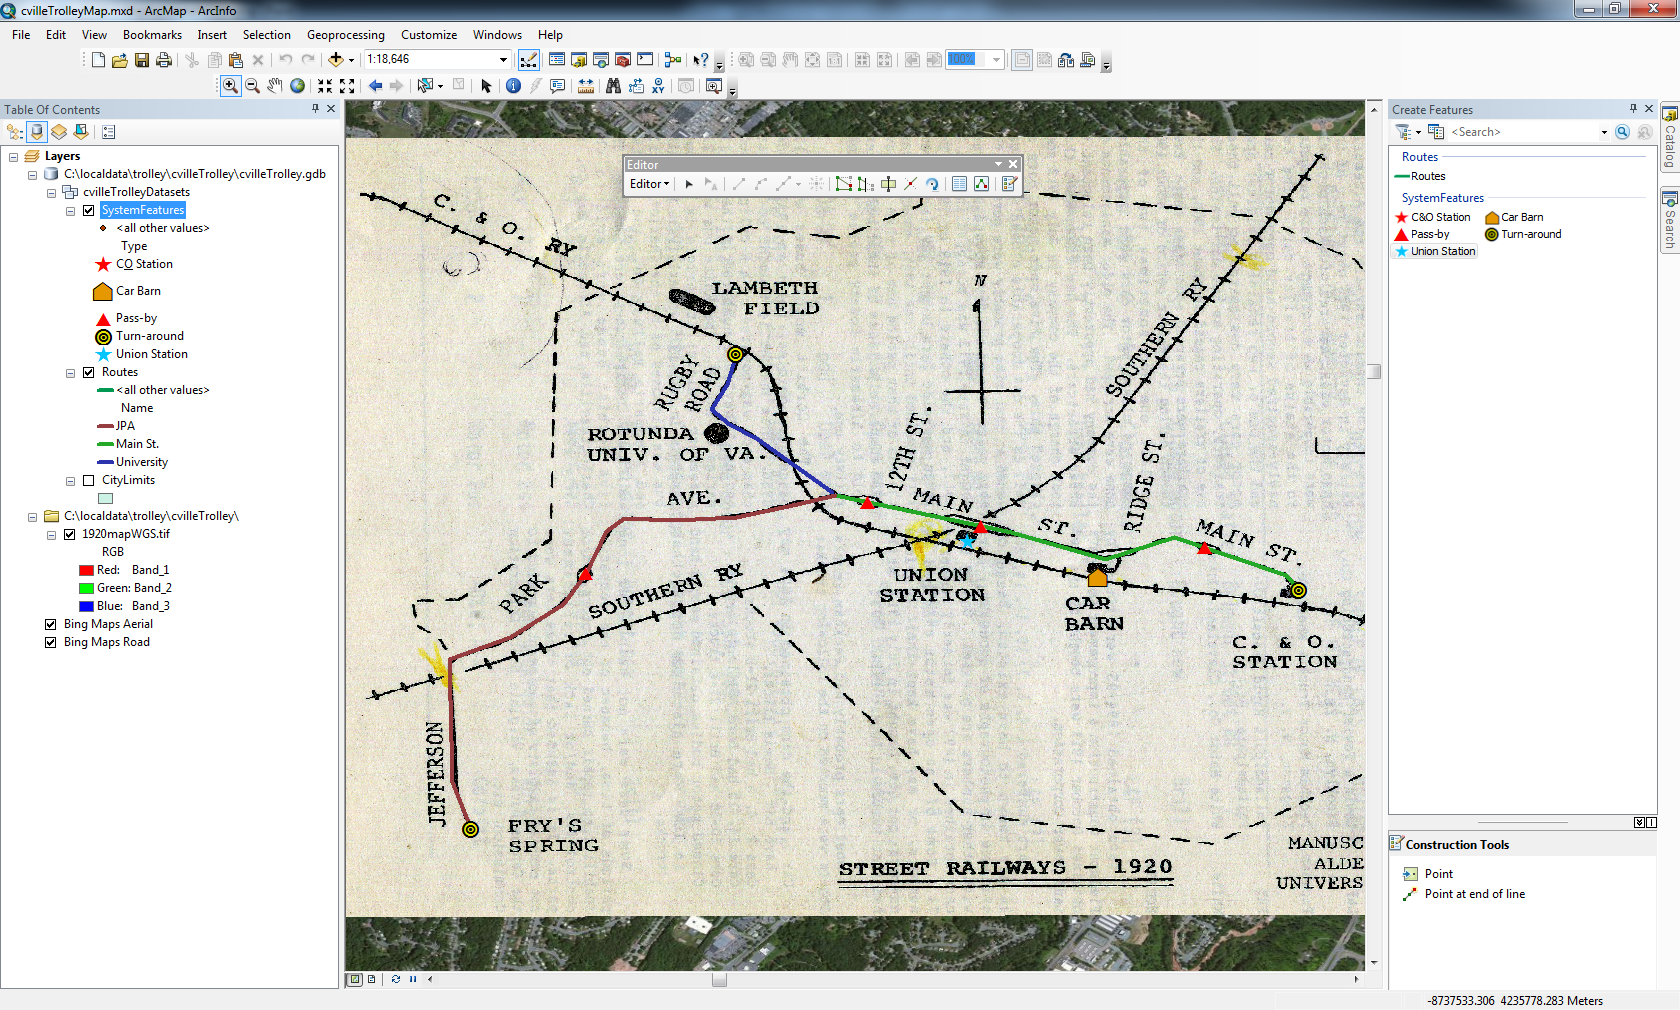
d. Browse into the cvilleTrolley directory and double-click cvilleTrolleyMap.mxd. This will launch ArcMap with cvilleTrolleyMap open. Alternatively, you can start ArcMap using the Start menu and then browse to cvilleTrolleyMap.mxd by clicking File > Open…. You should see something similar to the image shown here.
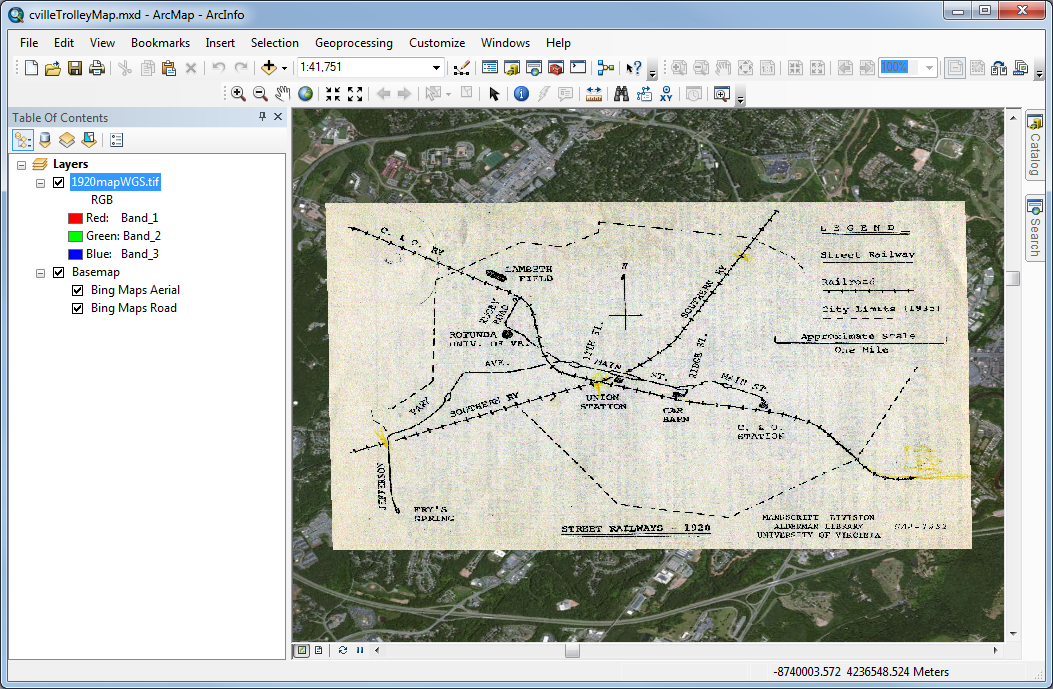
Trolley Map in ArcGIS -
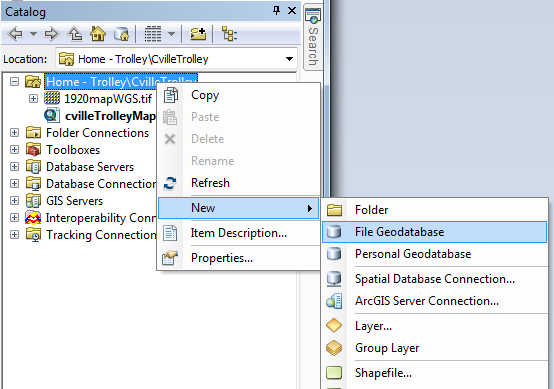
Create File Geodatabase Create a Geodatabase and Spatial Layers
A geodatabase is just what it sounds like, a place to store spatial data. There are several types of geodatabase; we will be using a file geodatabase. More on geodatabases here.
a. Launch ArcCatalog either by clicking the Catalog tab on the right side of your ArcMap window or clicking the Catalog Window button near the top of the ArcMap window in the Standard toolbar.
b. Browse to the directory where you extracted your ArcMap project.
NOTE: ArcCatalog emphasizes the use of links to working directories. The use of the list of “shortcuts” is why you may not see your directory in the tree in ArcCatalog. Once set up, ArcCatalog’s links can be very helpful but are often frustrating for novice users in the beginning. To create a direct link to your working directory, click the Connect to Folder button and browse to your directory through the Windows directory tree. You will only have to do this once; ArcGIS remembers the links and adds it to the list for next time.
c. In the Catalog pane, right-click on the cvilleTrolley directory > New > File Geodatabase.
d. Give your new file geodatabase a meaningful name like cvilleTrolley.gdb.
e. Right-click on your new database > New > Feature Dataset….
NOTE: A Feature Dataset is actually a collection of spatial layers (feature classes) grouped for a purpose. Maybe they are all the same theme like the roads from four adjacent counties or different themes of the same area. Feature Datasets have projections. Therefore, all the feature classes within must be in the same projection. When you add a Feature Dataset using the Add Data function, ArcGIS adds all of the feature classes within it to the Table of Contents (TOC). More on feature datasets and projections here.
f. Name it cvilleTrolleyDatasets and click Next.
g. We want to use the same projection as our georeferenced map. Click Import….
h. Select 1920mapWGS.tif, click Add.
i. Click Next. Click Next again to skip Vertical Coordinate Systems. Click Finish to accept defaults on other settings.
-
Adding the Field Name attribute to Routes (step 3.h) Add the feature classes. There will be three:
- CityLimits – a polygon layer
- Routes – a line layer
- SystemFeatures – a point layer
a. Right-click on cvilleTrolleyDatasets > New > Feature Class….
b. In the New Feature Class dialog, add CityLimits for Name. Accept default of Polygon Features for Type. Click Next.
c. Click Next to accept Default for Configuration Keyword.
d. Click Finish.
e. Repeat for Routes. Right-click on cvilleTrolleyDatasets > New > Feature Class….
f. In the New Feature Class dialog, add Routes for Name. Select Line Features for Type. Click Next.
g. Click Next to accept Default for Configuration Keyword.
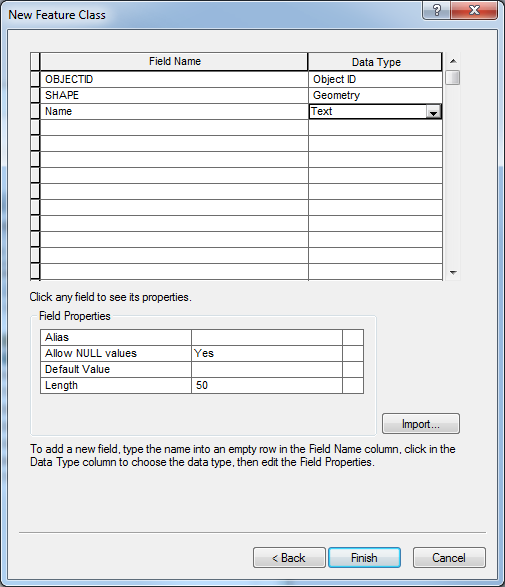
We want to store the name of the line in the Routes layer using attributes. We will add the field by entering a Field Name and selecting the Data Type.
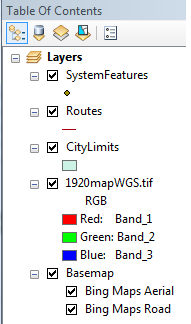
Table of Contents (step 3.l) h. Type Name in next available row under Field Name and select Text as Data Type.
i. Hit Finish.
j. Now, go back and make another feature class named SystemFeatures of Type Point Features with two new fields Name (Text) and Type (Text).
k. The tree for your project directory should now look like the the image shown here.

Project Directory (step 3.k) l. NOTE: ArcMap may have also loaded the new layers into your TOC. If not, you can drag and drop the whole dataset in the TOC.
-
Creating Features
- To add features to the feature classes we need to use ArcEditor. To begin using the editor, we must begin an edit session. An edit session is a safe place to work because you have to commit any changes before the feature class is changed. This is good because if you make a bad mistake, you can always back out of a session with no harm done. The flip side is that if you don’t commit your changes, you have lost all your work. More on editing here.
- We are also going to use a template to help us fill in some of the fields in a feature attribute table. Templates define where new features are stored, default attribute values, and default tools for creating features. When we start an edit session, ArcMap creates default templates for each layer if none already exist. We can also modify existing templates and create new templates. First, we want to categorize the types of features in the SystemFeatures layer and have ArcMap fill in the feature type in the attribute table.
- a. Right-click on SystemFeatures in the Table Of Contents (TOC) > Properties > Symbology.
- b. Click Categories.
- c. Select Type from Value Field.
- e. Click the Add Values… button.
- f. In the New Value area of the Add Values dialog box, enter Turn-around and hit Add to List.
- g. Do the same for Pass-by, Car Barn, Union Station, and C&O Station. Make sure all the values in the list are selected (highlighted), then click OK. Feel free to change the symbols by adjusting the color ramp and/or right-clicking on individual values and selecting Properties for Selected Symbols.
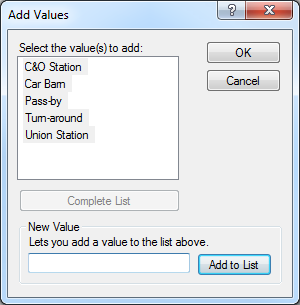
h. Hit OK to dismiss Layer Properties.
Notice your TOC has now changed to reflect your newly-created symbology.
i. Load the Editor toolbar by clicking Customize > Toolbars > Editor.
j. Start an edit session by clicking on the Editor toolbar Editor > Start Editing. This launches the Create Features pane showing the default templates for each layer.
k. We will start with CityLimits which is a polygon layer. Click on the layer in the Create Features pane to highlight it. Notice your cursor switches to a crosshair symbol.
l. Start tracing the perimeter of the polygon making sure to double-click on the last point to end the drawing of the feature. Since our historic map does not show the city limit boundary in the area of the map legend we must make a decision on how to proceed. With additional research, period maps showing this part of the boundary could be found and brought into our project to trace a more accurate city limit. Since the trolley route is our primary focus for this project we will draw a straight line boundary in this area but should note this cartographic choice in any description of this work.
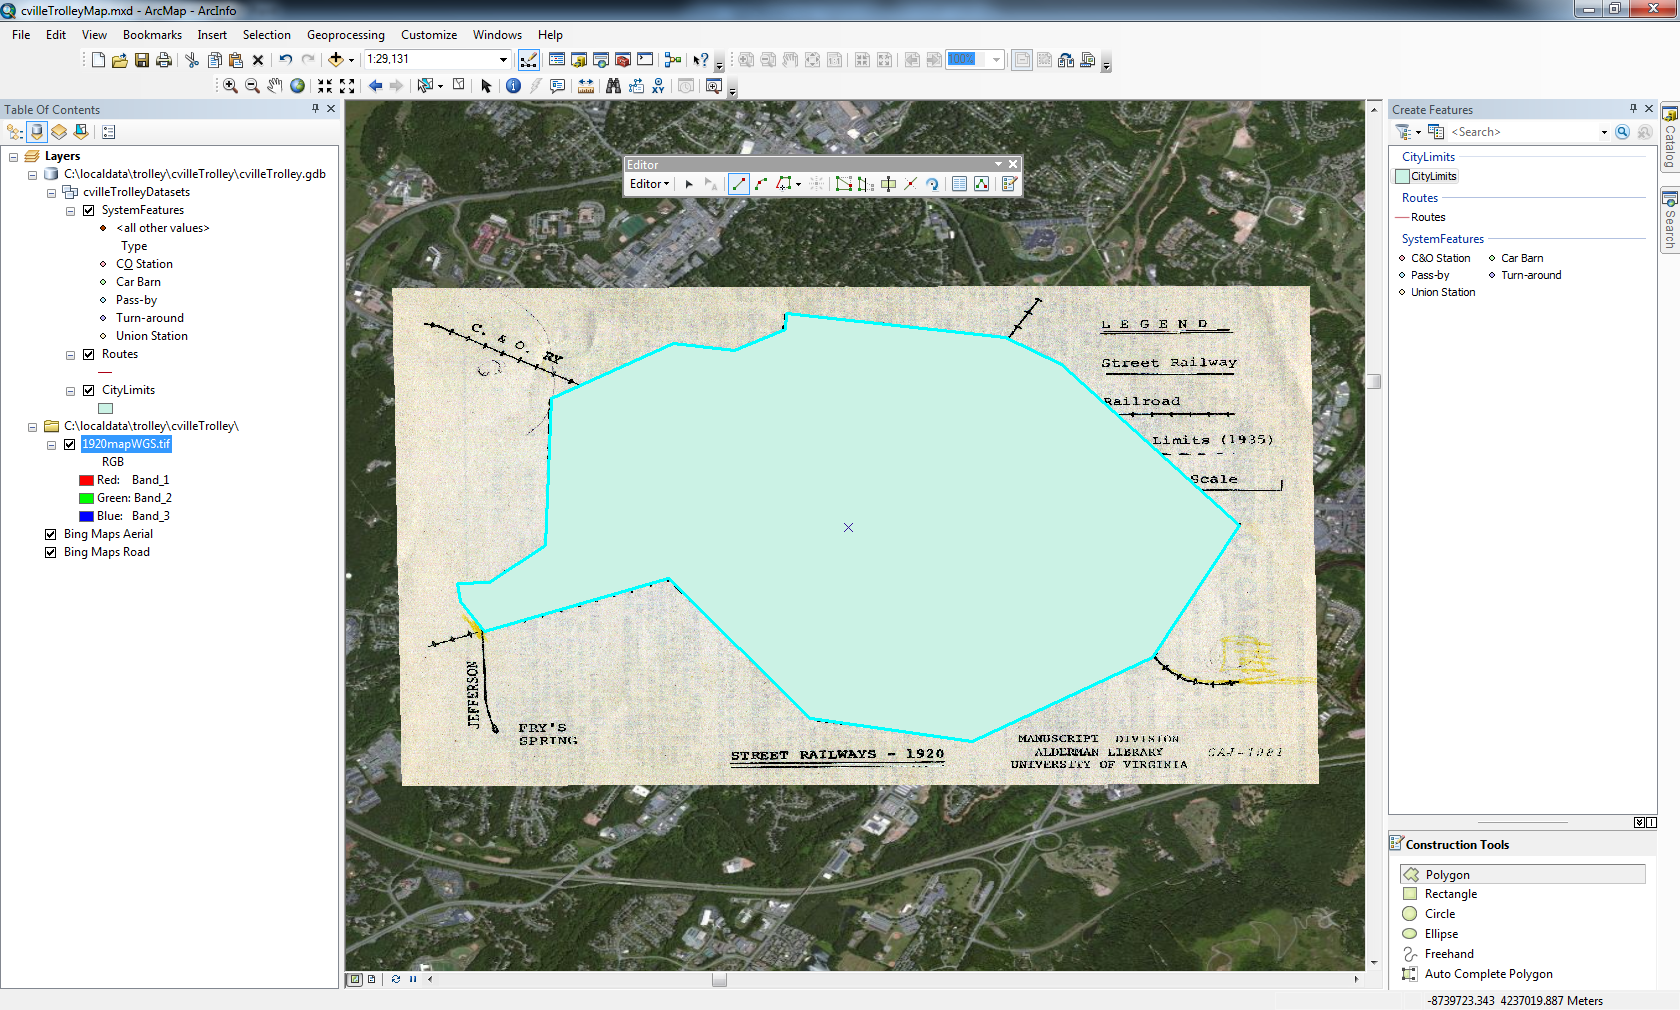
m. You can either toggle off the CityLimits layer by unchecking the box next to the name in the TOC or you can change the symbology to something hollow to enable you to see through to the map.
n. We are going to digitize three features for the Routes layer: Main St., Jefferson Park Ave (JPA), and University St. west of the Main St. and JPA intersection.
o. Open the Attribute Table for Routes by right-clicking on the name in the TOC and selecting Open Attribute Table.
p. Highlight Routes in Create Features.
q. Zoom in as necessary to include the Main St. line from the fork in the west to the turn-around in the east where the Main St. line ends.
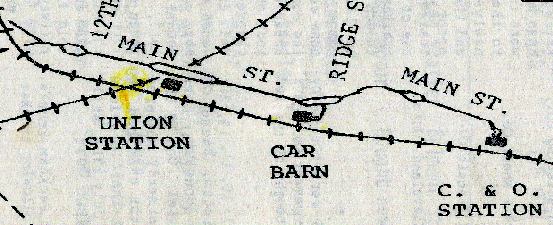
r. Start digitizing Main St. by starting at the fork on the west end and working east. Click to set vertices. The more points you put in a curve, the smoother it will look. Double-click to end.
You’ll notice the historic map shows double lines in some sections of the route where the tracks split to allow trolley cars to pass in both directions or “Pass-by”. To simplify, we will ignore these double lines and digitize only a single line. Later we’ll add point features to mark the Pass_by locations. Digitizing multiple lines for the Pass-by features could make sense for a more detailed analysis.
s. Notice the Attribute Table now shows a record for the feature you just created. Type "Main St." (no quotes) into the Name attribute, then from the Edit toolbar choose Edit / Save Edits to save your edits.

t. Position the map to include the whole JPA leg (southern fork). Start at the turn-around at Fry’s Spring and work back to the Main St. line.
NOTE: Notice that your cursor snaps to the end of the Main St. line and the symbol changes when you get close enough. This is good and ensures there are no gaps or dangles in our data.
u. Enter in JPA for Name in Attribute Table.
v. Repeat steps for University line.
w. You can categories the lines by the Name attribute to get different symbology for each line.
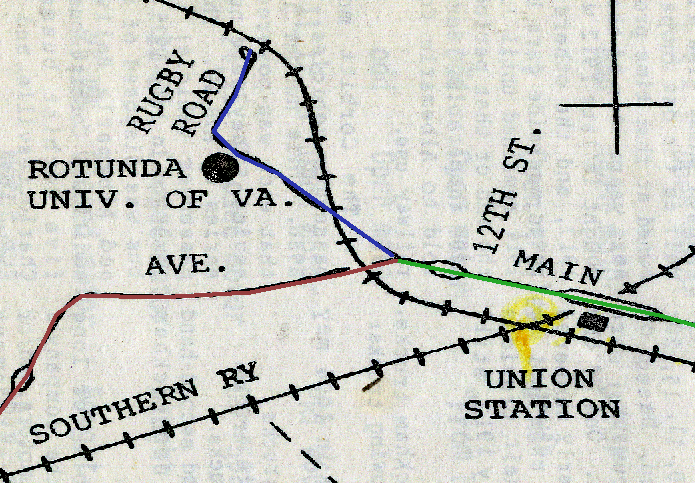
x. SystemFeatures are next. Highlight Turn-around under SystemFeatures in the Create Features and click on each turn-around. There are three. Notice the Attribute Table for this layer. Type is filled in automatically. You can add a name if you wish.
y. Repeat the steps for the pass-by, car barn, and train station features.
z. Save your edits and close the editor. You should know have something like the Final Map below.
Learn More
You took a historic georeferenced map and extracted three themes from it, city limits, streetcar routes, and streetcar system features.
Specifically you learned:
- How to create a geodatabase.
- How to create a feature dataset.
- How to create a new feature class.
- How to create a template for a layer for editing.
- How to create new features – points, lines, and polygons - within a feature class using ArcEditor.

