18 July 2013
Joining Census Data Tables to Shapefiles in ArcMap
This tutorial will demonstrate how to format census data tables from the U.S. Census Bureau᾿s American Factfinder and census Tiger Line shapefiles and then join the two and display the data on a map. Census data is a great resource that is reliable and well documented (always helpful for research). It is also collected and identified by geography and includes a wide range of geographic detail, from states to neighborhoods. This is ideal for GIS but the formatting of the data upon downloading is not ‘GIS-ready’ and there are several steps necessary to turn the raw downloaded data into a map.
In this tutorial you will learn to find U.S. Census and GIS data, and then format the two to work together and create a thematic map. We’ll use poverty levels in Nashville, TN; Music City, USA as our example for this guide.
Steps
-
Finding and downloading the census data.
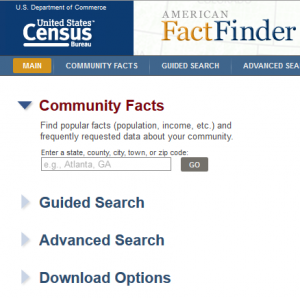
1a. American Factfinder a. Go to American Factfinder and start by clicking on ‘Advanced Search’ then ‘Show Me All’ and click ‘Geographies’ on the left
b. In the ‘Select Geographies’ window, choose the ‘Name’ tab. In the ‘Geography Filter Options’, select ‘Census Tract’ as your Geographic Type. You will then be given options to narrow down your tracts. Choose ‘Within State’ and select ‘Tennessee’ and then choose ‘Within County’ and choose ‘Davidson’ (which is Nashville).
c. You will see that your ‘Geography Results’ on the right have been limited by your choices under ‘Your Geography Filters’ on the left. Select ‘All Census Tracts within Davidson County’ under ‘Geography Results’ and click ‘Add’. You have now added those Tracts to ‘Your Selections’ at the top left of the FactFinder page and you can now close the ‘Select Geographies’ box.
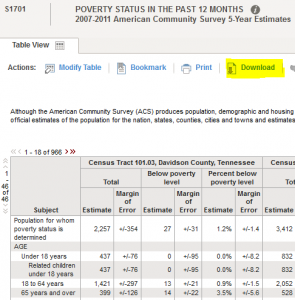
1e. Poverty Status d. Now it’s time to select your variables. Click ‘Topics’ on the left and then choose ‘People’, then ‘Poverty’, and click ‘Poverty’ again, at which point it will be added to ‘Your Selections’ at the top left and you can close the ‘Select Topics’ box.
e. Since you have now made your geographic and variable selections, you can click ‘Poverty Status in the Past 12 Months’ in the ‘Search Results’ box and you will see a table for the Poverty Status variables for the Census Tracts in Davidson County, TN.
f. Click the ‘Download’ button at the top and select the first option to download a comma delimited file for your data in a single file.
-
Formatting your data for use with GIS
Upon downloading your chosen census variables you must open your data in Excel and properly format the worksheet before adding it to ArcMap and joining it to a GIS shapefile. Factfinder datasets often come with more information that is necessary for your interests. A natural first step is to eliminate unnecessary data.
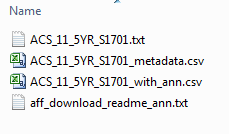
2a. Zip archive a. Right click the downloaded ‘ACS_11_5yr_S1701.zip’ file and choose ‘Extract All…’ to unpack the .zip file contents. Then open the ‘ACS_11_5YR_S1701_with_ann.csv ‘ file in Excel. This file contains the census data values.
b. Make a copy of your dataset in case you accidentally erase something you later realize you need (File → Save As, and save as ‘NashvilleTractsPoverty’)
c. For this project, we are only concerned with percent below poverty and we will discard the other data as well as the margins of error. You can find more information about what each column contains by opening the ‘ACS_11_5YR_S1701_metadata.csv’ file in Excel. We want to keep column H, ‘HC03_EST_VC01’, which shows the percent below poverty level for the population from whom poverty status is determined.
d. Select the columns D, E, F, and G using the top row, then right click and delete those rows. Then select all of the populated columns after the percent below poverty column (now column D, ‘HC03_EST_VC01’) and delete them as well. Your spreadsheet should now only have 4 columns.
e. Select cell D1 which should read ‘HC03_EST_VC01’ and rename it ‘PctBelowPov’ for ‘Percent Below Poverty.
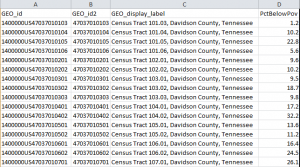
2f. Renamed Columns f. Rename ‘GEO.id’ to ‘Geo_id’ and ‘GEO.id2’ to ‘Geo_id2’ and ‘GEO.display-label’ to ‘GEO_display_label’ to meet ArcMap naming rules listed below. Later we will use the ‘Geo_id2’ column for a tabular join.
g. Click File → Save to save the changes you’ve made in your worksheet.
h. Our poverty data has only one row of headers but when working with your own data keep the first row of headers and delete any additional header rows. ArcMap only accepts one header row.
i. The following suggestions will help you come out with a GIS-ready dataset. You will need to rename the headers so that they make sense to you, but be sure to keep the following rules in mind when naming your headers:
- They cannot start with a number
- They cannot include figures other than text, numbers, or underscores
- They cannot include spaces
- ArcGIS will allow you to use longer field names in a join from Excel, however if you choose to save a shapefile to include your new data it will truncate the field names to 10 characters, therefore you may wish to limit your header column names to 10 characters now
- Make sure you do not have any empty header cells, or multiple cells with the same name
- You may wish to create a codebook for decoding your new headers in the future
-
Downloading your GIS data
a. Go to TIGER/Line Shapefiles in a web browser, preferably Firefox or Internet Explorer.
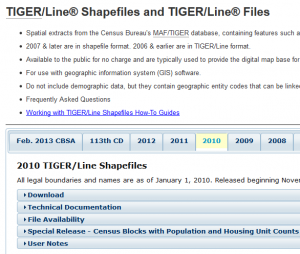
3b. Download TIGER/Line Shapefile b. Click the tab ‘2010’, then click Download, then Web Interface.
c. Select ‘Census Tracts’ in the pull down menu, and click ‘submit’.
d. In the ‘2010’ menu, select Tennessee and ‘Submit’. Then select ‘Davidson County’ and click ‘Download’.
e. Save the .zip file to your machine in the same folder where you saved your Census data – make sure you know where you are saving it!
f. Once it’s saved, navigate to the file, right click it and extract the files from the Zip Folder. This will create a new folder named tl_2010_47037_tract10 that contains your shapefile.
-
Formatting your GIS data
Your Tiger Line shapefile also requires a small amount of formatting. We will base the join on the data in the‘GEOID’ field in the shapefile, but it is not the proper field type for joining to excel data (The GEOID field is a text field and it needs to be a ‘double’ field to be able to join the ID field in the excel data, which is also ‘double’). These steps will help you load your data and create a new field that is properly formatted.a. Open ArcMap and click File / Add Data / Add Data
b. Navigate to your downloaded (and extracted) Tiger Line Shapefile (you may have to use the ‘connect to folder’ button if you saved these files in a location that has not previously been accessed from ArcMap)
c. Select the tl_2010_47037_tract10.shp dataset and click ‘Add’
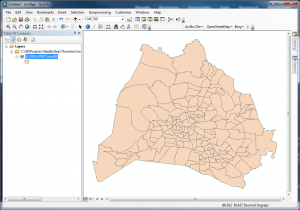
4c. Tract layer added to ArcMap d. Right click the dataset name in the ‘Table Of Contents’ and click ‘Open Attribute Table’
e. Click the white ‘Table Options’ button at the top left corner of the table and select ‘Add Field’
f. Name the field ‘ID2’, set the type as ‘Double’, and click ‘OK’
g. Scroll to the right of the table and find the new ‘ID2’ column
h. Right click the ‘ID2’ column header and select ‘Field Calculator’
i. In the ‘fields’ box, find and double click the ‘GEOID10’ field so that the bottom of the window reads ID2= [GEOID10]
j. Click ‘OK’ and the Contents of the GEOID10 field will be calculated into the ‘ID2’ field, which is in the proper format for joining to your worksheet
-
Joining the census data to the GIS shapefile
Once all of your data is formatted properly you can add your excel file and join it to your Shapefile.a. In Excel, save your work and close ‘NashvilleTractsPoverty.csv’.
b. In ArcMap, click File / Add Data / Add Data
c. Navigate to your edited ‘NashvilleTractsPoverty.csv’ file (again, you may have to use the ‘connect to folder’ button if you saved these files in a location that has not previously been accessed from ArcMap)
d. Select the file in the ‘Add data’ window and click ‘Add’
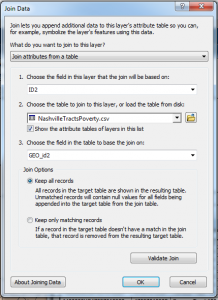
5g & 5h. Join dialog e. You will now see your worksheet in the Table Of Contents under your shapefile name
**Note: When you add a worksheet, the Table of Contents view switches from ‘Drawing Order’ to ‘Source’. You can change the view using the icons directly below the words ‘Table of Contents’. ‘Drawing Order’ is a nicer and more functional view, but will not show your worksheet.
f. Right click the shapefile name (tl_2010_47037_tract10)and select ‘Joins and Relates → Join’
g. In the ‘Join Data’ dialogue box be sure the dropdown ‘Join attributes from a table’ is selected then choose’ID2’ (the ID Field you created) in field 1, the name of your worksheet (NashvilleTractsPoverty) in field 2, and ‘GEO_id2’ in field 3
h. Be sure ‘Keep all records’ is selected, then click ‘OK’ to complete the Join
i. To ensure that the Join worked properly, right click the name of the shapefile in the Table of Contents (tl_2010_47037_tract10)and select ‘Open Attribute Table’
j. Scroll to the right in the table and you should see your data after the first ‘ID2’ field. The last field should be ‘PctBelowPov’. If the cells contain values (as opposed to reading) your join was successful
k. Close the table when finished
-
Viewing your data
Now for the fun part. Once you have joined your data to the GIS shapefile, it is time to create a map!
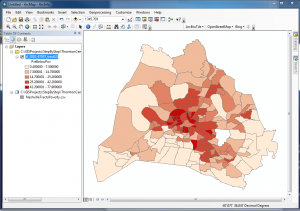
6g. Poverty data displayed on the map a. Right click the shapefile name in the Table of Contents (tl_2010_47037_tract10) and select ‘Properties’
b. Select the ‘Symbology’ tab
c. Select the ‘Quantities’ option under ‘Show:’
d. Select the ‘PctBelowPov’ variable in the ‘Value’ field
e. Select a light-to-dark color ramp in the ‘Color Ramp’ pull down menu
f. Click ‘OK’
g. Your data will now be displayed on the map
h. Go wild with your GIS and Cartography skills to add a legend, title, and all the classic map elements
-
Saving your data
You may wish to save a copy of the shapefile that includes your census variables. This will make your data easier to share or use in multiple map projects without relying on an excel sheet and a join.a. With your data still joined, right click ‘tl_2010_47037_tract10’ in the Table of Contents and click ‘Data → Export Data’. Be sure ‘All features’ is chosen from the drop down.
b. Under ‘Output Feature Class’ browse to the location where your tracts shapefile is saved and choose the name ‘Joined_Tracts.shp’ for your new shapefile.
c. Set ‘Save as type:’ to ‘Shapefile’.
d. Click Save, then OK and ArcMap will export a copy of your shapefile that includes the census variables that you joined. Click Yes to add this new shapefile to your map.
e. Repeat the steps above to symbolize your new shapefile.
f. In ArcMap choose File / Save to save your ArcMap project file.
Learn more
- About Joining and Relating Tables from ArcGIS 10.0 online help
- Essentials of Joining Tables from ArcGIS 10.0 online help
- Joining Attributes in One Table to Another from ArcGIS 10.0 online help
- Adding Map Elements from ArcGIS 10.0 online help

